



SEM operating techniques and key points of EDS analysis
Release time:
2024-01-30
As one of the commonly used equipments in daily material analysis and research, scanning electron microscope shows its unique advantages. Compared with traditional optical microscopes, electron microscopes are known for their high resolution, wide magnification range and good image depth of field. In addition, its easy sample preparation process makes it widely used in many fields such as biology, material science and environmental science.
As one of the commonly used equipments in daily material analysis and research, scanning electron microscope shows its unique advantages. Compared with traditional optical microscopes, electron microscopes are known for their high resolution, wide magnification range and good image depth of field. In addition, its easy sample preparation process makes it widely used in many fields such as biology, material science and environmental science.
I. Basic structure of scanning electron microscope
The basic structure of a scanning electron microscope can be divided into two main parts: the barrel and sample chamber are located on the left side, while the imaging and recording system is on the right side. These two areas are interconnected by a synchronized scanning generator and a signal detector. The overall structure is shown below:
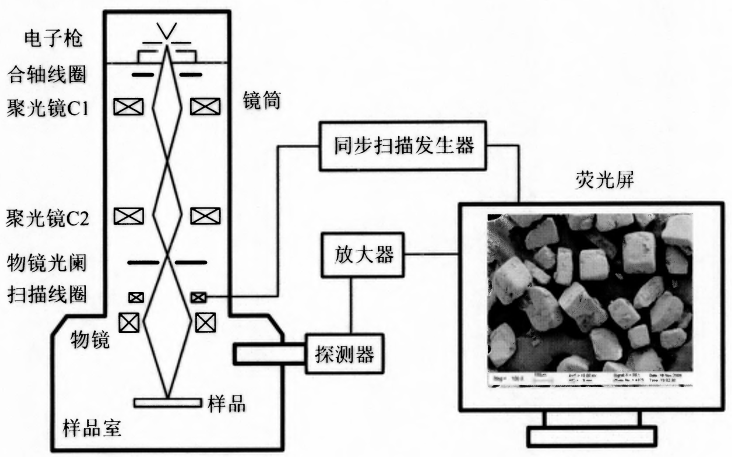
The imaging principle of the scanning electron microscope is similar to that of television imaging, both of which rely on the scanning function of the electron beam. The synchronized scanning generator is responsible for controlling the scanning coil in the barrel and the scanning coil of the monitor to ensure that the electron beam emitted by the electron gun and the electron beam on the monitor are synchronized to scan point by point, row by row, and frame by frame on the sample and the fluorescent screen. The detector receives the signals excited by the electron beam at each point on the sample, and these signals are amplified and transmitted to the monitor to adjust the brightness of the corresponding scanning points on the fluorescent screen. Due to the different signal strengths generated at each point of the sample, the brightness of the corresponding point on the fluorescent screen also changes, thus forming a scanning image.
II. the detection signal of the scanning electron microscope
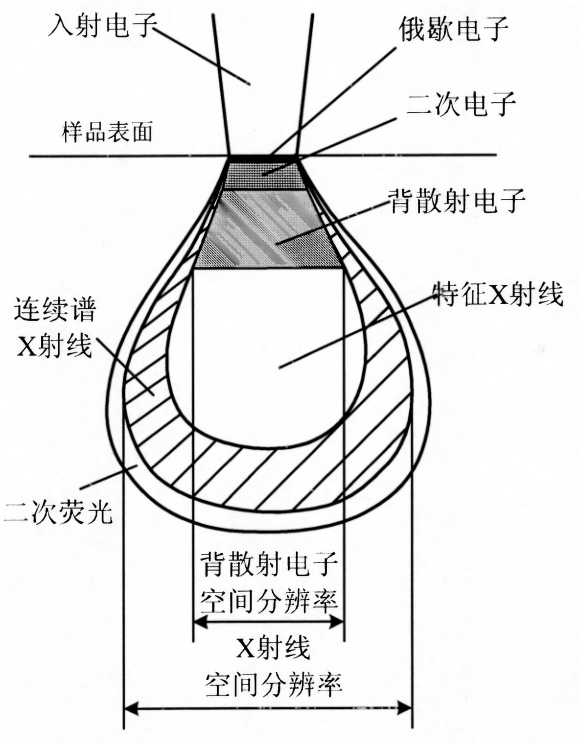
The information provided by the scanning electron microscope is mainly based on the interaction between the electron beam and the sample. When the incident electron beam interacts with the sample, a variety of signals such as backscattered electrons, secondary electrons and characteristic X-rays are generated. Backscattered electrons are released from the sample surface in the opposite direction after the incident electrons have been scattered at a certain depth inside the sample, and they carry information about the sample's morphology and composition, and their generation range is about 1/3 of the depth of the interaction, i.e., between about 10nm and 1000nm. Secondary electrons are generated by the ionization of the outer electrons of the sample atoms by incident electrons. These electrons are of low energy, mostly less than 50 eV, and are mainly emitted from the surface of the sample in the region of 10 nm or less, and they reveal the surface topography of the sample. Characteristic X-rays, on the other hand, are the energy released when electrons in the outer shell layer of an atom fill the empty spaces after ionization of the inner layer of the atom by incident electrons. This energy exists in the form of X-rays at specific wavelengths and carries information about the chemical composition of the element, which is generated in the range of about a few micrometers. Characteristic X-rays are important signals for performing elemental compositional analysis. Therefore, it is crucial to select and adjust the appropriate parameters in the operation of a scanning electron microscope.
III. the parameters of the scanning electron microscope adjustment
The working parameters of scanning electron microscope mainly include accelerating voltage, probe current, objective diaphragm and phase dissipation adjustment. These parameters have a significant impact on the acquired electron microscopy images. Next, we will discuss the role of these parameters one by one.
1. Selection of accelerating voltage
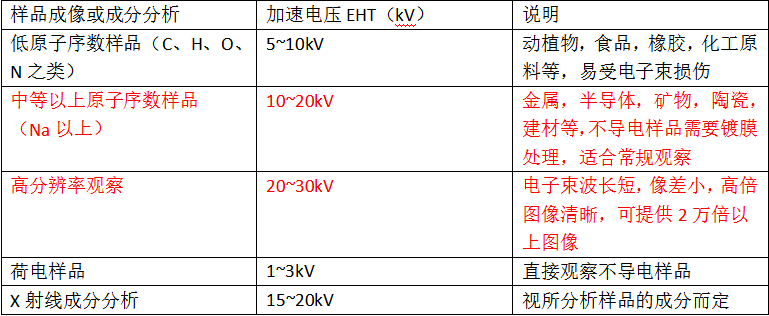
The accelerating voltage is critical to the performance of a scanning electron microscope. Typically, scanning electron microscopes are capable of providing accelerating voltages ranging from 0.2 to 30 kilovolts (kV). Selection of the appropriate accelerating voltage requires consideration of the type of sample and the purpose of the analysis. The table below lists some references when selecting an accelerating voltage:
2. Selection of Probe Current
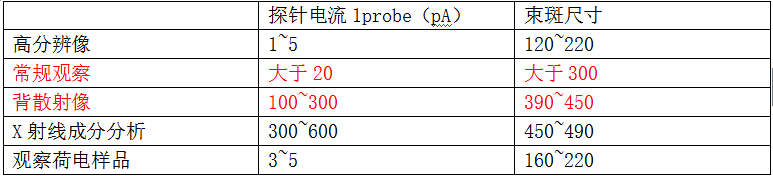
Probe current is the stream of electron beam emitted by the electron gun, which will converge into a smaller beam spot size after being adjusted by the spotting scope, and then incident on the sample. The size of the probe current directly affects the spot size, i.e. the higher the probe current, the larger the spot size increases. Depending on the mode of operation, different probe currents or spot sizes can be selected, as shown in the table below:
3. Selection and adjustment of objective diaphragm
When observing an image at thousands of times magnification, if the image appears to move during the focusing process, this indicates that the objective lens diaphragm may not be properly aligned with the center axis. In this case, adjustment using the objective lens diaphragm adjustment knob is required to ensure that the diaphragm is aligned to the center axis. This can be done by referring to the photo provided. First, activate the Reduced raster function and position the scanning area over a specific feature in the image. Then, activate the Wobble function and observe if the image appears to move irregularly. If the image does move, the X and Y knobs need to be carefully adjusted until the image stabilizes and shows only a slight "breathing" flicker. At this point, the alignment of the diaphragm is complete and the vibration function can be turned off. When switching to higher magnification images, be sure to adjust the objective diaphragm after the electron gun is aligned to eliminate astigmatism and ensure a clear image.

There are usually three objective diaphragms, and you can view specific information about them, including the diameter and position of the diaphragm aperture, by clicking on "Edit data". This data is displayed in a table, but please note that the diaphragm parameters may vary from one electron microscope to another. the XY position readings correspond to the scales on the adjustment knobs, and the distance between each diaphragm is approx. 3 mm.
By adjusting the Y knob, different inner diameters of the diaphragms can be selected. For routine observations, aperture number 2 is usually chosen.The OptiBeam program continuously calculates the lens parameters and if it determines that the currently selected aperture is the best option, the screen will display "Best Aperture = yes". However, there may be times when the program suggests a different diaphragm and "Best Aperture = No" will be displayed.
After replacing the diaphragm, the co-axial adjustment must be redone to ensure sharpness and stability of the image.

4. Phase Dissipation
When observing a high magnification image, if you find that the image is still not sharp even after repeated focus adjustments and that blurred edges appear in the vertical direction of the image, as shown in the left and center images in Photo 1, this is usually due to the phenomenon of phase dispersion. Astigmatism is an optical aberration that causes the image to focus differently in different directions, resulting in a blurred effect. In order to obtain a clear image, measures must be taken to eliminate astigmatism.

When dealing with the problem of astigmatism in grainy images, especially at an accelerating voltage of 10kV and a magnification of 15,000x (15kX), there are three methods of astigmatism elimination that can be used:
a. Minimize the blurred edges by clicking on the Dispersion icon in the drop-down menu and dragging up and down or left and right using the left mouse button. After performing this operation, focus again to observe the improvement in sharpness. This process may need to be repeated until the image reaches satisfactory sharpness. Refer to the figure on the right to see the effect after defocusing.
b. Click Stigmation on the diaphragm screen and drag the sliding scale on the XY coordinate line individually to reduce the amount of blur and thus improve image sharpness.
c. Use the two Stigmation knobs on the Manual Operation Panel and turn them slowly to remove the blurred edges of the image. This method is also an effective manual adjustment that can be used in electron microscopes that do not have an automatic defocusing feature.
Each of these methods can be effective in adjusting the astigmatism, and the choice depends on the operator's preference and the specific configuration of the instrument.
5. EDS Operation
Energy dispersive X-ray spectroscopy (EDS) is one of the most commonly used functions in a scanning electron microscope (SEM). Most SEMs are equipped with an energy spectrometer, which allows the user to analyze the composition of a sample over a micro-region. The energy spectrometer works by detecting X-rays emitted by the sample, which have unique characteristic energies for different elements. The spectrometer unfolds a spectrum based on these energies, where the horizontal coordinates represent the characteristic energies and the peaks of the spectrum for different elements appear at specific locations. The height of the peaks on the vertical coordinate reflects the content of the element. The results of qualitative or quantitative analysis of the composition of a microregion can be obtained by specific program calculations.
The setting of conditions for the energy spectrum analysis can be carried out via the interface shown below:
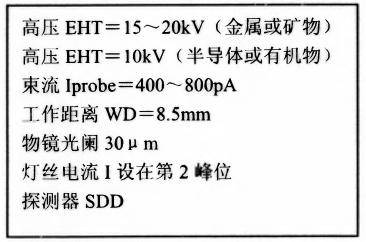
When performing Energy Dispersive X-Ray Spectroscopy (EDS), the following key points need to be noted:
a) The working distance should be adjusted to 8.5 mm to ensure that the angle between the detector and the sample surface is 35 degrees. This angle helps to optimize the X-ray detection efficiency.
b) The choice of accelerating voltage (EHT) should be eclectic, and a setting of 20 kilovolts (kV) is usually adequate for the analysis of most elements. For elements with lower atomic numbers, a lower accelerating voltage can be chosen.
c) Quantitative analysis requires a high count rate, so a higher probe current (Iprobe) can be selected, as long as the dead time of the energy spectrum is kept below 30%, which ensures normal working efficiency. Dead time is the percentage of time that the detector is unable to process consecutive X-ray events. Excessive dead time will affect the accuracy of quantitative analysis.

ZEPTOOLS ZEM18 Benchtop Scanning Electron Microscope
ZEPTOOLS is a scientific instrument company with fully independent intellectual property rights. Since the 1990s, our R&D team has been committed to providing excellent instruments for nanoscience research. At present, the company has a number of product lines including PicoFemto series of in-situ TEM measurement system, in-situ SEM measurement system, ZEM series of benchtop scanning electron microscope, JS series of step profiler, nano-displacement stage, two-dimensional material transfer stage, probe stage and cryogenic system, grating Ruler etc., which have gained a high degree of attention at home and abroad, and filled the gaps of the country's high-end precision instruments in the field of a number of blank.
Related News

Contact Us
Mobile Phone: 15756003283
Email: support@zeptools.com、micage@zeptools.com
Address: No.15, Electronic Venture Park, Dongshi, Tongling City, Anhui Province, China